Correlation Between Food Environment And Health

Summary:
This project is designed to identify any correlation between food environment and health outcome. According to CDC, approximate 34% of adults and 15 - 20% of children in the U.S. are obese. Obesity rate have continued to increase over the past 3 decades. We call this the "Obesity Epidemic" in the U.S. There are many factors contribute to the problem, but this project only focus on how food environment correlate to health outcomes. This project is a replication of the research paper "Examining the relationship between the food environment and adult diabetes prefvalence by county economic and racial composition: an ecological study" by Haynes-Maslow & Leone, Aug 09, 2017.
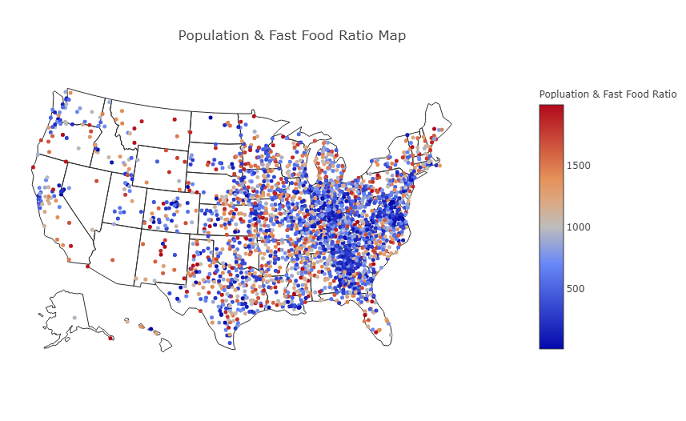
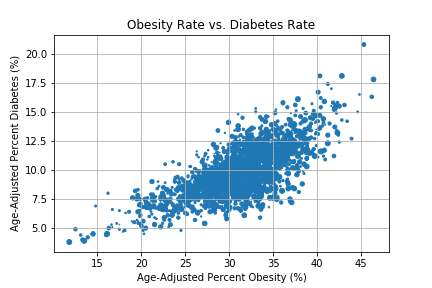
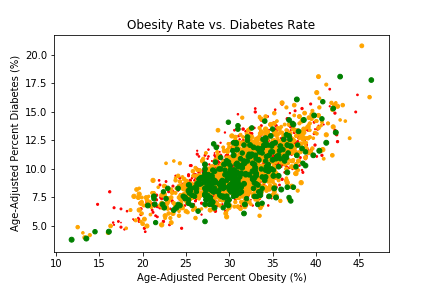
In order to identify the correlation between food environment and health outcomes, we need to identify the dependent variable (health outcomes) and the independent variable (food environment) for the analysis. In this study, we choose obesity rate and diabetes ratio as the dependent variables. Food environment is defined by the density of fast food restaurants in a particular region in the US. The study is at the county level scale. The ultimate goal of this project is to identify any statistical signficant correlation between county food environment and health outcomes in the data. We will be using visual and statistcal tools to present our results.
Data Resources
This study is based on the health data collected from CDC for the year 2013 and the Yelp API request. Even though the health data was collected in the year 2013, it is very reasonable to assume that the food environment would not have a dramatical change at the county level in the past decade. We also used the U.S. Census Bureau data for the county population and "Simple Maps Geographic Data" for identifying the counties geographical locations. After cleaning the data, we have total observations, n = 2302 counties, in our study.
- Data
- Centers for Disease Control and Prevention (CDC)
- U.S. Census Bureau
- Simple Maps Geographic Data Products
- Yelp API Request


.png)
.png)